Just for Fun
Ski Planning
Created a tool to explore ski resorts that are part of the NE Epic Pass ❄️
Office Wall Art
These projects had the simple purpose of creating pretty wall art that fit into my office color scheme (the second visualization deviated a bit from the colors but I’m a sucker for purple so I let it slide!). All three were created with Charticulator and were my first experimentation with custom visuals inside of Power BI. I was initially excited about the release of Charticulator within Power BI but after some exploration I found it to be a bit cumbersome to work with and slow to render. These were really fun to create but I’m looking to other custom visuals such as Deneb for my future work.

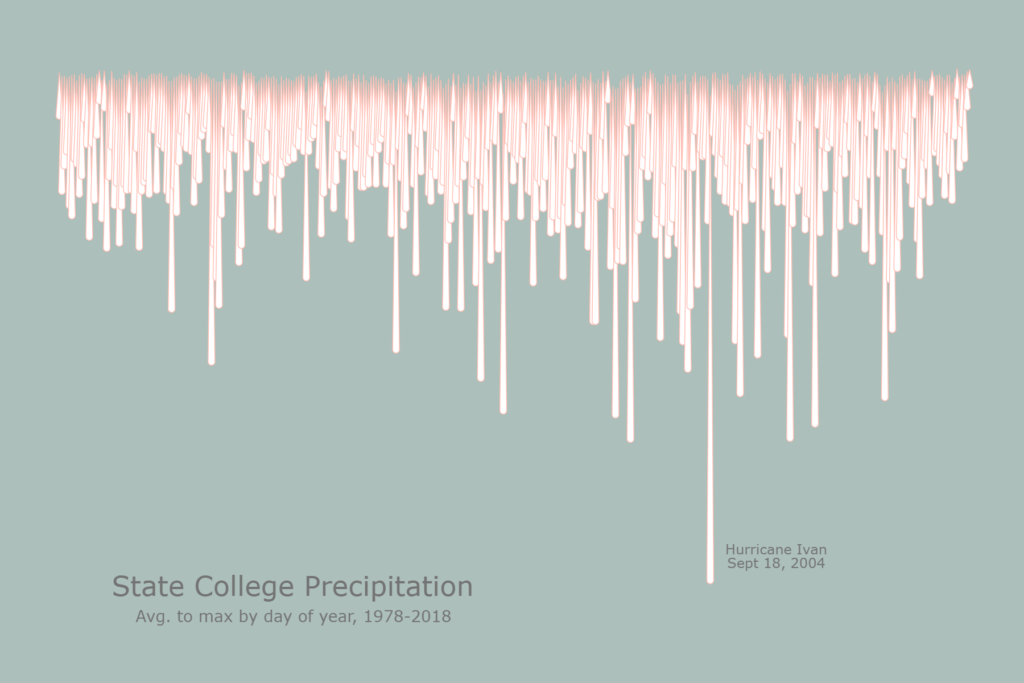
Average to max precipitation by day of the year for my home town
This is the largest of the visuals displayed on my office walls and fits in perfectly in terms of scheme. I love how the lines are like drops of rain!
Had this been a professional project, I would have added x and y axes labeling the day number of the year moving from left to right and the max rainfall on each day number as the length of the drop. But I wanted simplicity so kept it sparce (I wasn’t planning to add any data labels until I saw the outlier on 9/18/04 — that data point I had to include!).

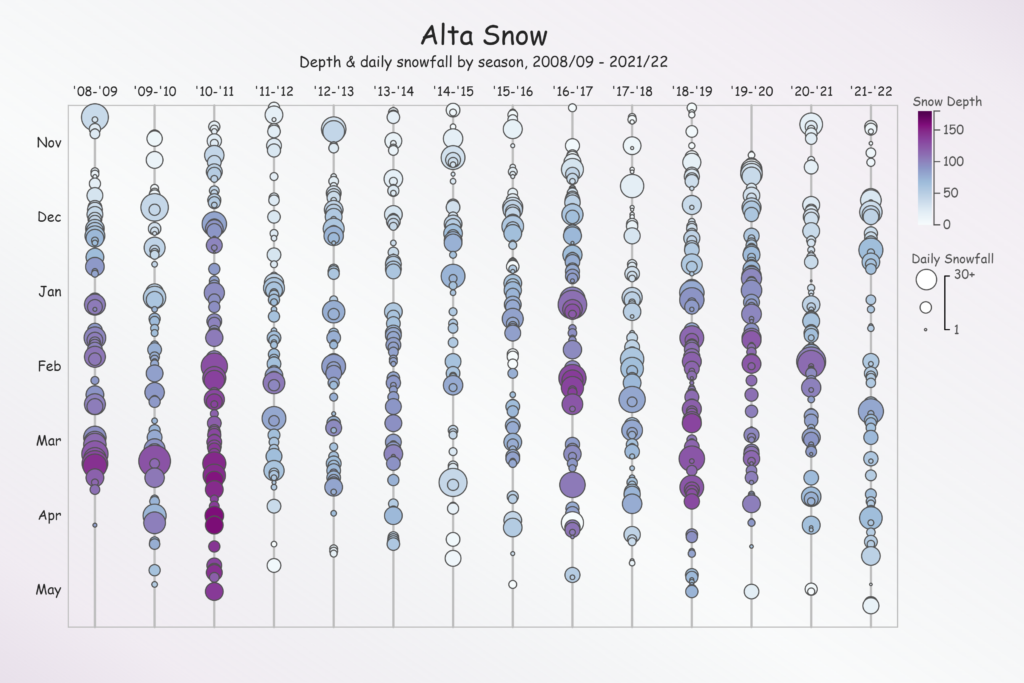
Alta ski season snowfall
My only ventures outside of the East Coast to ski have been to the Salt Lake City, Utah area resorts and Alta is one of my favorites. I’ve had the opportunity to visit three times over the last several years but each time I go I hit one of the driest weeks of the season. I was curious to explore the combination of both snowfall by day and total snow accumulation to see where my trips fit into each season. I had intended to label the dates of my trip with rectangle overlays but liked the visual without them and didn’t want the extra noise. (I’ll always know my trips fell on days where the lines behind the bubbles are visible😣!)

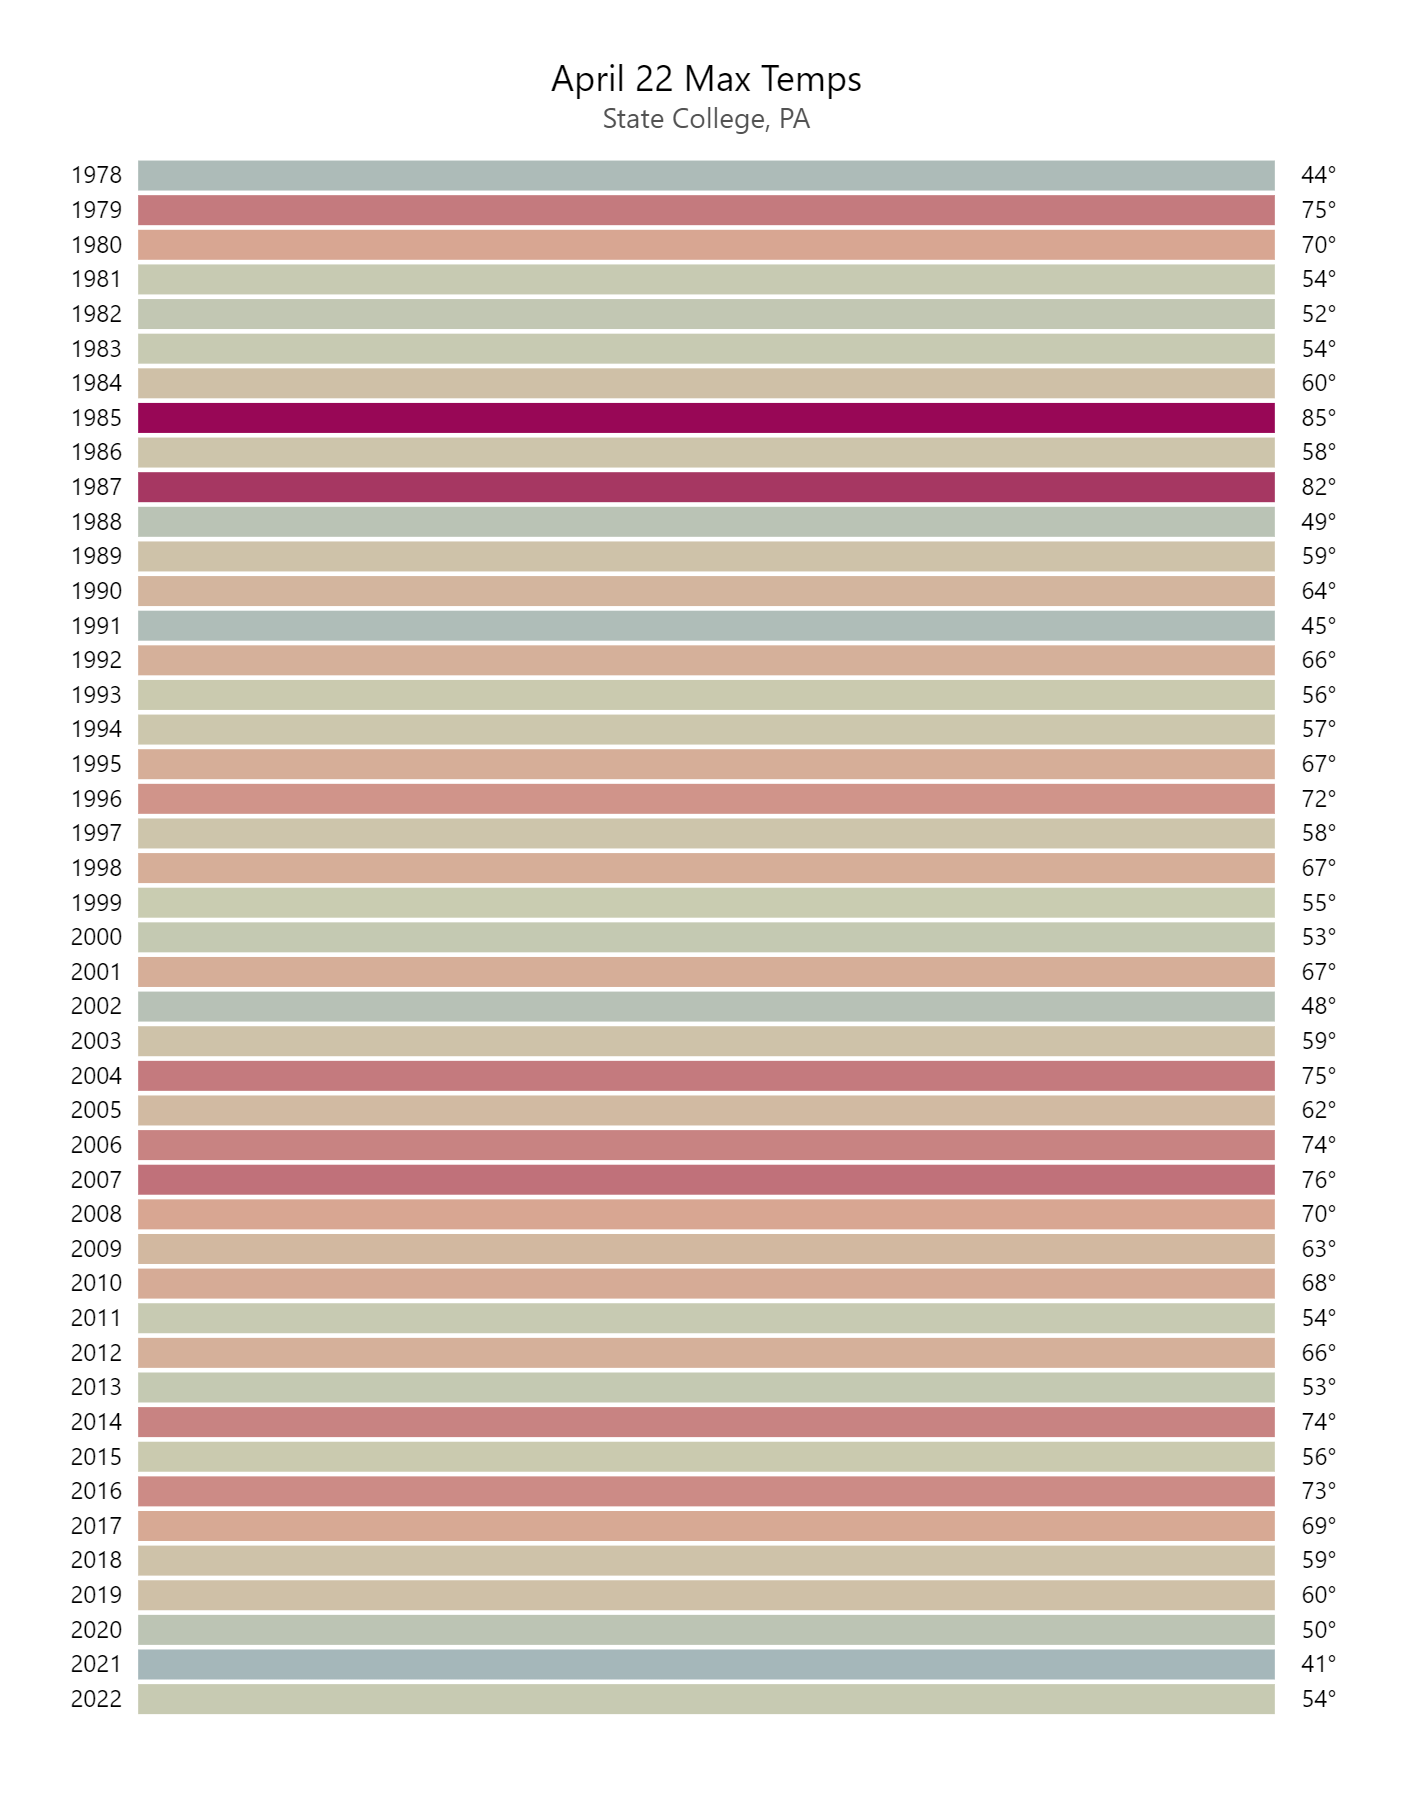
Temperatures on my birthday
This is a very simple visual but adds just the right pop of color to my office. Plus, it’s my proof that the temperature swings on my birthday are real! I could have a gorgeous 70 degrees day with sunshine or I could be relegated to the indoors while watching the flurries come down (minus the days that I ski, I hate the cold).
My Puppy’s Growth
Daphne was adopted in February 2021 and I was curious to see how fast she was growing and if her growth was leveling off in the first year. (It wasn’t, she made it to 26 pounds!)
This gave me the opportunity to play around with images in tooltips. And of course, to use a heart emoji, something I’ll never get away with in a professional report!